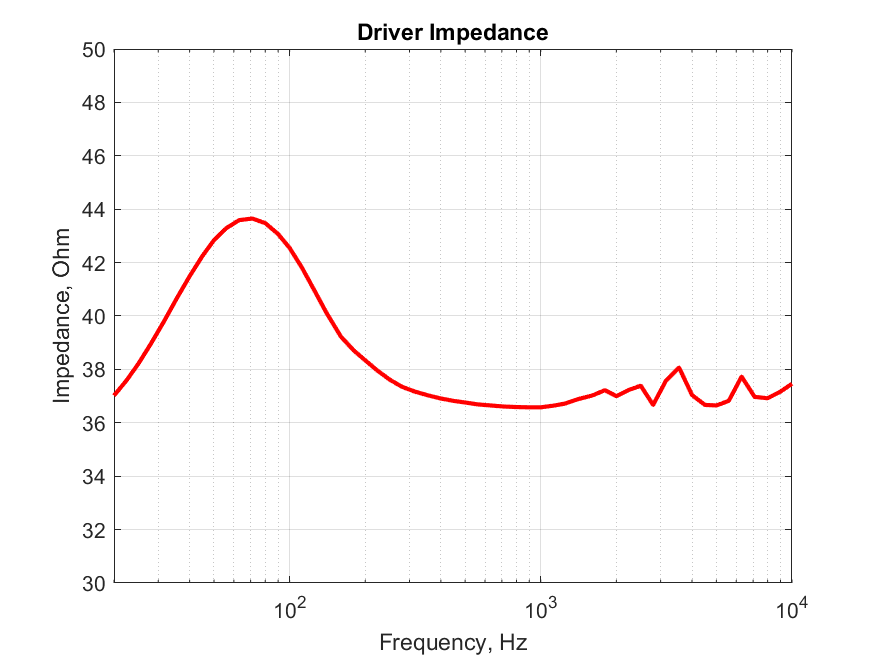
In the previous post, I derived the circuit equations for the electro-mechanical part of the lumped model and derived the voltage-current transfer function, $G_{ui}$, which is also the Impedance of the driver. Since we needed to find the values of the constituent elements/parameters of the transfer function equation, which invariably are the T/S parameters of the driver too, by fitting the equation to measured data, I set out to pick out the data from the Impedance chart that’s on the Ole Wolff website.
I attempted using the online tool which my friend suggested me to use, which is this one -> Graph Reader. Somehow it didn’t quite work out for me. So, I then decided to take the manual approach. It wasn’t that tedious as I initially thought it would be. Maybe in 10 mins, I had all the data from the chart. When you hover the mouse over each point on the chart on the OW website, a balloon shows the X and Y values which are the frequency and the corresponding impedance value respectively. I opened a spreadsheet and started writing down each value pair in a table format.
I then set up a MATLAB script to read the Excel spreadsheet and plot the data. MATLAB has this very cool file import feature/tool using which you can just import data into any given format, or can ask it to generate a script or a function which can be re-used later to read similar kinds of files. They are super handy. I must say, I love MATLAB a lot for features like these. It is quick and easy. 😉 I couldn’t do nothing much beyond this task today evening.
Here is the script though, in case, it helps you somehow 🙂
(The EXCEL file import part is auto-generated by MATLAB. I only then wrote the plotting part of the code)
Also, I mentioned yesterday, that the DC resistance value of the driver was $34 \Omega$. This was based on what the website said. However, as I was reading data from the impedance plot, the minimum value on the chart was not $34 \Omega$. It was $36.58 \Omega$. (In the Matlab code, you will see me finding this value from the data, by passing it through the min(..) function). This is not a defect. Often manufacturers target to achieve a certain value of DC resistance. However, there are minor variations from specimen to specimen. So it could just be that the driver that was measured to obtain data corresponding to the chart on the product webpage had this variation. However, since we only have this one measurement data set with us and are going to use it as an example throughout this project, I would be changing my DC resistance value to be $36.58 \Omega$ all the way and not use $34 \Omega$.
clc;
clear;
close all;

%% Import the data from the Excel spreadsheet

% Set up the Import Options and import the data
opts = spreadsheetImportOptions("NumVariables", 3);

% Specify sheet and range
opts.Sheet = "Sheet1";
opts.DataRange = "A3:C57";

% Specify column names and types
opts.VariableNames = ["Var1", "Frequency", "Impedanceohms"];
opts.SelectedVariableNames = ["Frequency", "Impedanceohms"];
opts.VariableTypes = ["char", "double", "double"];

% Specify variable properties
opts = setvaropts(opts, "Var1", "WhitespaceRule", "preserve");
opts = setvaropts(opts, "Var1", "EmptyFieldRule", "auto");

% Import the data
ImpedanceData = readtable("D:\Blog\VadakkootAcoustics\Posts\LumpedModelling_OleWolff_part4\ImpedanceData.xlsx", opts, "UseExcel", false);

%% Convert to output type
ImpedanceData = table2array(ImpedanceData);

%% Clear temporary variables
clear opts

%% Find the DC resistance - Finding the minimum (least) value of the impedance data

DC_resistance = min(ImpedanceData(:,2));

%% Plot the impedance data in a X (log)-Y (linear) plot

ImpedFig=figure(1);
semilogx(ImpedanceData(:,1), ImpedanceData(:,2), 'LineWidth', 2.0, 'Color','r');
xlim([20,10000]);
ylim([30,50]);
grid on;

xlabel("Frequency, Hz");
ylabel("Impedance, Ohm");
title("Driver Impedance");

saveas(ImpedFig, "D:\Blog\VadakkootAcoustics\Posts\LumpedModelling_OleWolff_part4\OW_DriverImpedance",'png');